Water Quality Sampling
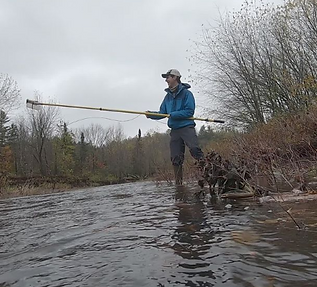
The Water Quality Monitoring program is a volunteer-run sampling program that takes place each summer throughout the Basin. Through partnership with the Vermont Department of Environmental Conservation’s LaRosa Analytical Services Partnership Program, the MRBA has access to the State of Vermont’s analytical laboratory to process and analyze the water samples taken in the field.
The goal of the monitoring project is multifaceted. This volunteer program allows community members to learn about the environment of the Missisquoi River Basin, conservation and restoration of this environment, and water quality sample collection with interpretation of the results. In addition, the program collects valuable data that may aid in the determination of specific problem areas on which to focus restoration efforts, and of whether past restoration efforts are working.
Why do we sample?
-
Missisquoi Bay contributes over 200 metric tons per year of non-point source phosphorous to Lake Champlain, accounting for more than any other segment of the lake.
-
A 75% reduction in P loading will be needed to meet the new TMDL water quality standards.
-
Sampling will help us track our progress as we implement changes across our landscape aimed at curbing non-point source pollution. Individual projects to address localized erosion, agricultural runoff, and stormwater are small fractions of a very large whole. Sampling can give us a “big picture” to measure the cumulative success of our efforts.
-
Sampling results inform decisions about where to direct our efforts.
Our History
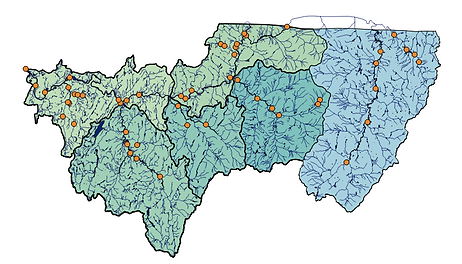
The Missisquoi River Basin Association has been sampling in our region since 2005 with the LaRosa Program. Over this span, more than 55 sites throughout the watershed have been monitored for total phosphorus, total nitrogen, total chloride, phosphate, and turbidity.
_JPG.jpg)


This interactive map shows all of the MRBA's water sampling sites from 2005-2018
Map Navigation Information: To zoom in to specific points, use the + and - icons in the top left. You can then click on the sample point to learn more about it, such as what subwatershed it is located in, general location information, and GPS coordinates. Click the >> icon to view the legend, which allows you to view 2018 sample sites separately from all sample sites. To adjust your view of the map simply click and drag your cursor, and the map will move.


